When you start an experiment, after one to two weeks the first results will start to appear. They are updated once a week. We show you how to interpret the results of the experiment on Amazon.
Read on or watch our video!
Probability
When you enter them, one of the first data that catches your eye is the probability expressed as a percentage.
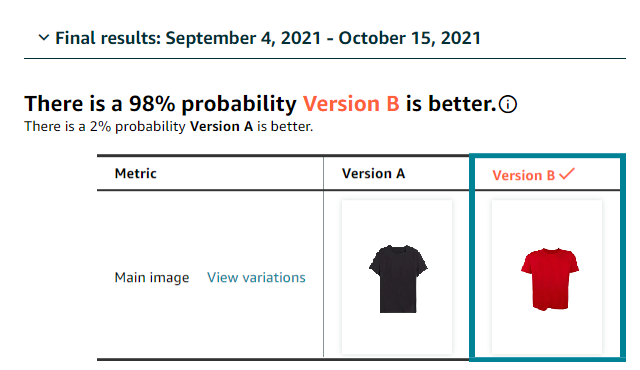
This number indicates the probability of a version impact occurring. That is, if the experiment shows that version A of a photo has a better impact on sales and the probability is 75%, this means that in 75% of cases this positive impact should be present.
The higher the probability, the greater the chance that the impact of a particular version will be true.
Key data
Below in the table you will find metrics such as units, sales, conversion rate, units sold per unique visitor, units sold from search, sales from search and sample size.
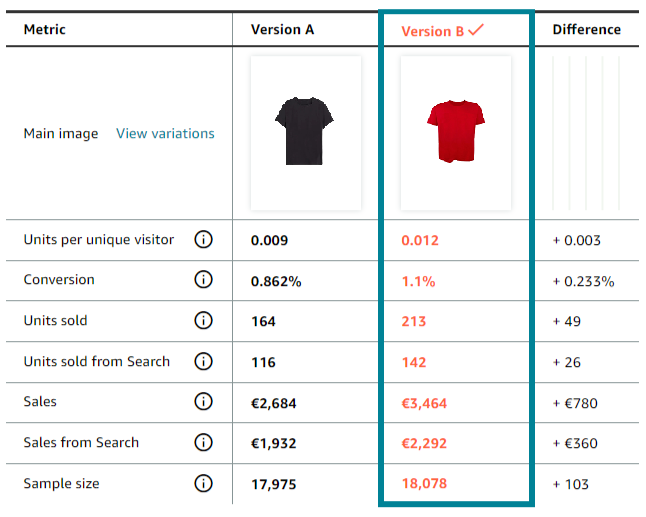
Which indicators you see exactly depends on the type of test. In the case of a title test, more are displayed.
Based on these figures, you can clearly see which version of the listing is performing better, i.e. which is achieving better sales.
Chart
Next to the table you will see a bar chart which shows the units sold, sales and conversion rate on a weekly basis.
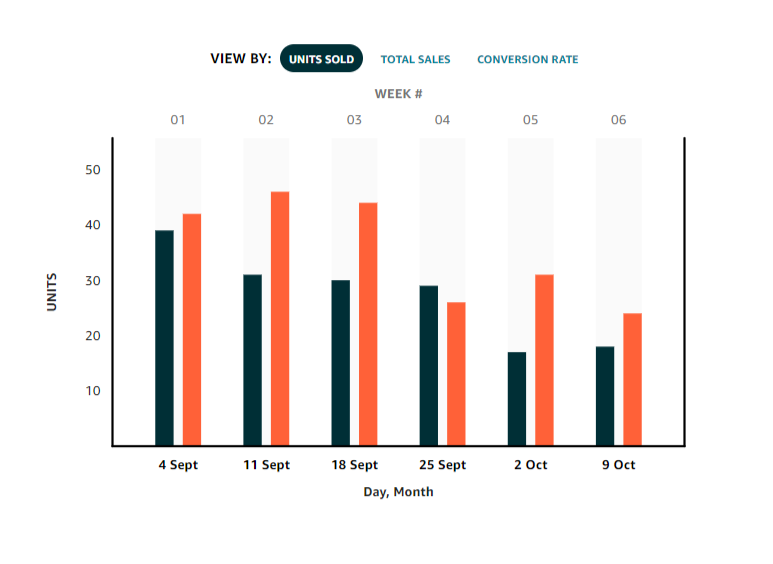
This is helpful to see how these metrics have evolved over the course of the experiment.
If, for example, the metrics stayed at similar levels for nine weeks, and one week for one of the versions skyrockets, it could mean that both versions are similarly influential and the results from one week were random.
Impact estimate
If your experiment is complete, then in addition to this data available you will also see a one-year forecast of the impact of choosing this ‘better’ version on sales. This includes the best case, the worst case and the most likely case.
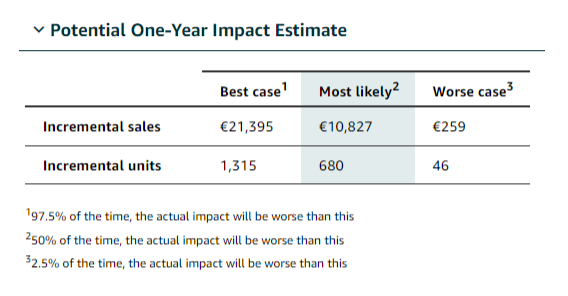
There is no need to put too much weight on this forecast, as it does not take into account any other factors that may affect sales during the year.
To calculate it, the average daily sales growth over the duration of the experiment for the winning version is taken and multiplied by 365 days.
Amazon itself warns against misusing this forecast and points out that in the case of a worst-case scenario, the effect of the winning version may be negative and it may be that the losing version would have delivered better results in the long term.
Do you now know how to interpret the results of your experiment on Amazon?
Want to know more about Amazon experiments?
Follow our blog and channel and stay up to date.